Data & Methodology
Scoring System, Evaluation Framework & Results
Executive Summary
Science-fair competitions (ISEF, STS) select for a rare combination of technical depth, independent research ability, and competitive drive — traits that compound in venture-backed founders. Science Fair Fund uses a proprietary ML scoring system to evaluate these alumni at each investment stage, enabling three portfolio construction decisions: prioritizing sourcing, sizing initial checks, and concentrating follow-on capital.
The scoring system's edge is early identification: at founding — before any institutional capital — the top quartile produces $100M+ outcomes at 3.5× the baseline rate. Signal strengthens through funding and Series A as information accumulates, enabling disciplined capital allocation at every stage.
- Primary metric: $500M+ outcomes (stable sample, directly relevant to fund returns). $100M+ and $1B+ shown for context.
- Two evaluation frameworks: Selection Advantage (does scoring concentrate winners within each stage?) and Predictive Validation (does the model generalize forward in time?).
Data Universe
Reference cohort = VC-investable alumni-linked companies founded 2006–2020, with outcomes observed through early 2026. Every company has at least five years of maturity.
| Cohort | Companies | Funded | Series A+ | $100M+ | $500M+ | $1B+ | Unicorn Rate |
|---|---|---|---|---|---|---|---|
| All Years | 375 | 177 | 119 | 48 | 35 | 28 | 15.82% |
| 2006–2020 (Ref.) | 78 | 177 | 119 | 38 | 25 | 28 | 14.19% |
| US / Canada | 127+ | 110+ | 78+ | ~34 | ~23 | 19 | ~17% |
Over 90% of $1B+ outcomes are US-headquartered, consistent with the fund's North American deployment focus. Outcome rates are stable across founding vintages.
Scoring Methodology
The fund operates two complementary evaluation systems, each answering a different question about alumni founders.
Ranking Model (V4 Ensemble). Each company receives a stage-specific score based on its highest-scoring founder. The score is a within-cohort rank — not a calibrated probability — designed to sort companies relative to peers at each decision point. It answers: who should we prioritize?
Outcome Prediction (Walk-Forward CV). Separately, a walk-forward cross-validated model tests whether the ranking generalizes forward in time — trained on earlier cohorts, evaluated on later ones — using only information available at each stage. It answers: does the model actually predict who wins?
Three Decision Points
At Founding. Competition results, education trajectory, and sector signals available before institutional funding. Focuses sourcing on the highest-potential alumni.
At First Funding. Founding signals augmented by round size, investor quality, and co-founder composition. Primary signal for initial check sizing.
At Series A. Funding signals plus milestone progression — time to Series A, round scaling, traction markers. Drives follow-on concentration.
Feature Importance by Stage
| Signal Category | At Founding | At Funding | At Series A |
|---|---|---|---|
| Competition/Awards | #3 | #3 | #6 |
| Skills | #5 | #5 | #3 |
| Education | #4 | #4 | #5 |
| Capital/Stage | — | #2 | #2 |
| Sector/Market | #1 | — | #4 |
Ranked by feature importance share within each stage. The top four named categories account for over 70% of model weight at every stage. At founding, competition results and sector lead; by Series A, capital progression and technical depth dominate — execution evidence rather than biographical priors.
Selection Advantage
The ranking model's cross-sectional test: within each stage cohort, does the score concentrate future winners into a smaller, actionable subset? Companies are grouped into quartiles by rank and measured at the $100M+, $500M+, and $1B+ thresholds.
Across all three decision points, the scoring system concentrates $500M+ outcomes toward the top of the ranked list. The quartile tables below show how outcome rates and lift vary across score tiers at each stage.
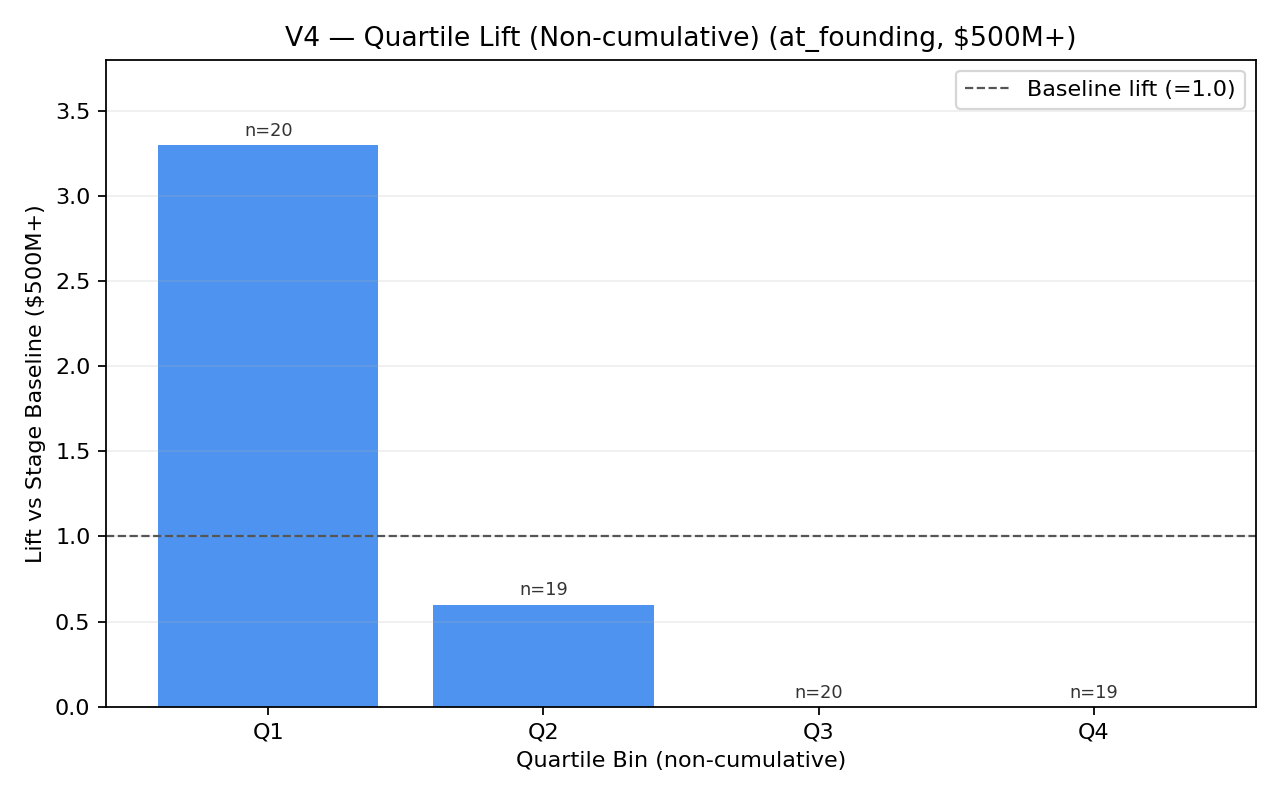
At Founding
n=78 • Baseline $500M+: 9.0% • Top quartile: 30.0% (3.3×)
| At Founding (n=78) | n | $100M+ | Lift | $500M+ | Lift | $1B+ | Lift |
|---|---|---|---|---|---|---|---|
| Top Quartile (Q1) | 20 | 45.0% | 3.5× | 30.0% | 3.3× | 25.0% | 3.2× |
| Upper-Mid Quartile (Q2) | 19 | 5.3% | 0.4× | 5.3% | 0.6× | 5.3% | 0.7× |
| Lower-Mid Quartile (Q3) | 20 | 0.0% | 0.0× | 0.0% | 0.0× | 0.0% | 0.0× |
| Bottom Quartile (Q4) | 19 | 0.0% | 0.0× | 0.0% | 0.0× | 0.0% | 0.0× |
| Baseline | 78 | 12.8% | 1.0× | 9.0% | 1.0× | 7.7% | 1.0× |
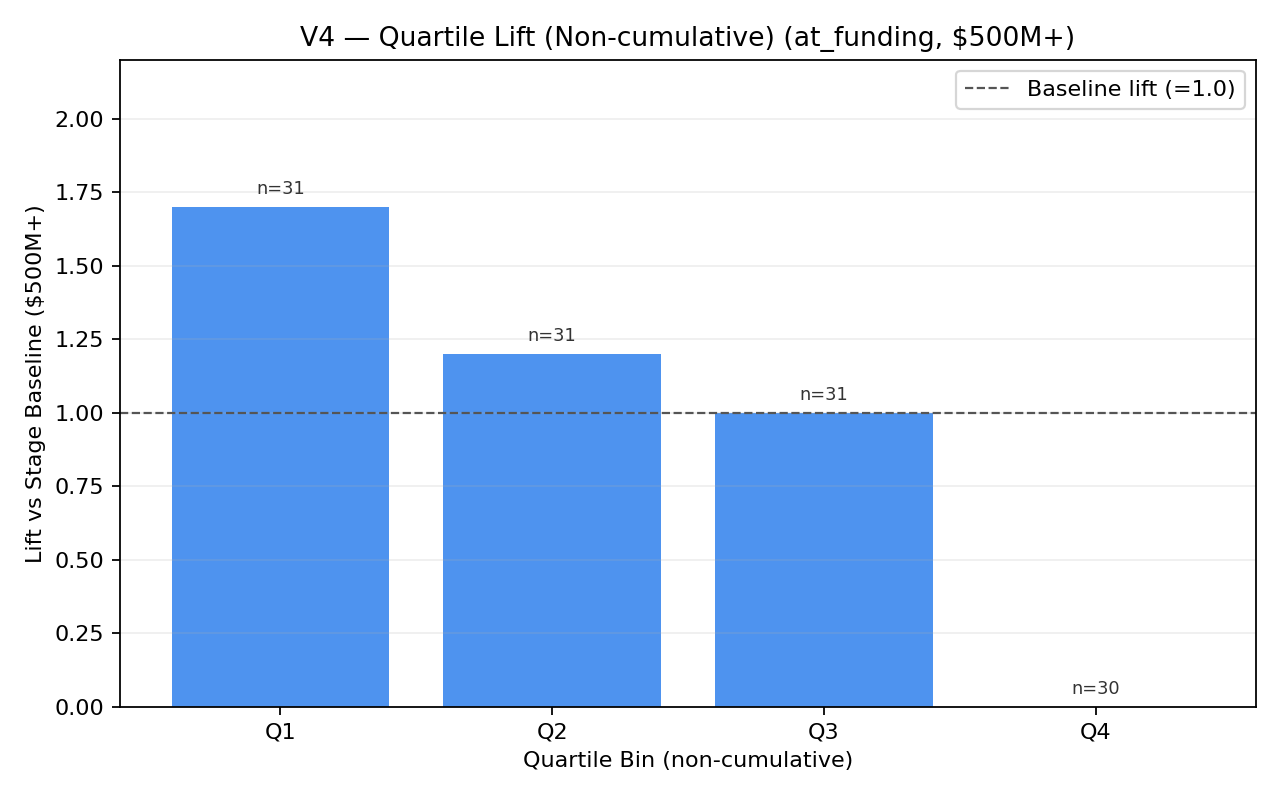
At First Funding
n=123 • Baseline $500M+: 18.7% • Top quartile: 32.3% (1.7×)
| At First Funding (n=123) | n | $100M+ | Lift | $500M+ | Lift | $1B+ | Lift |
|---|---|---|---|---|---|---|---|
| Top Quartile (Q1) | 31 | 54.8% | 1.9× | 32.3% | 1.7× | 29.0% | 1.9× |
| Upper-Mid Quartile (Q2) | 31 | 35.5% | 1.2× | 22.6% | 1.2× | 19.4% | 1.3× |
| Lower-Mid Quartile (Q3) | 31 | 22.6% | 0.8× | 19.4% | 1.0× | 12.9% | 0.8× |
| Bottom Quartile (Q4) | 30 | 0.0% | 0.0× | 0.0% | 0.0× | 0.0% | 0.0× |
| Baseline | 123 | 28.5% | 1.0× | 18.7% | 1.0× | 15.4% | 1.0× |
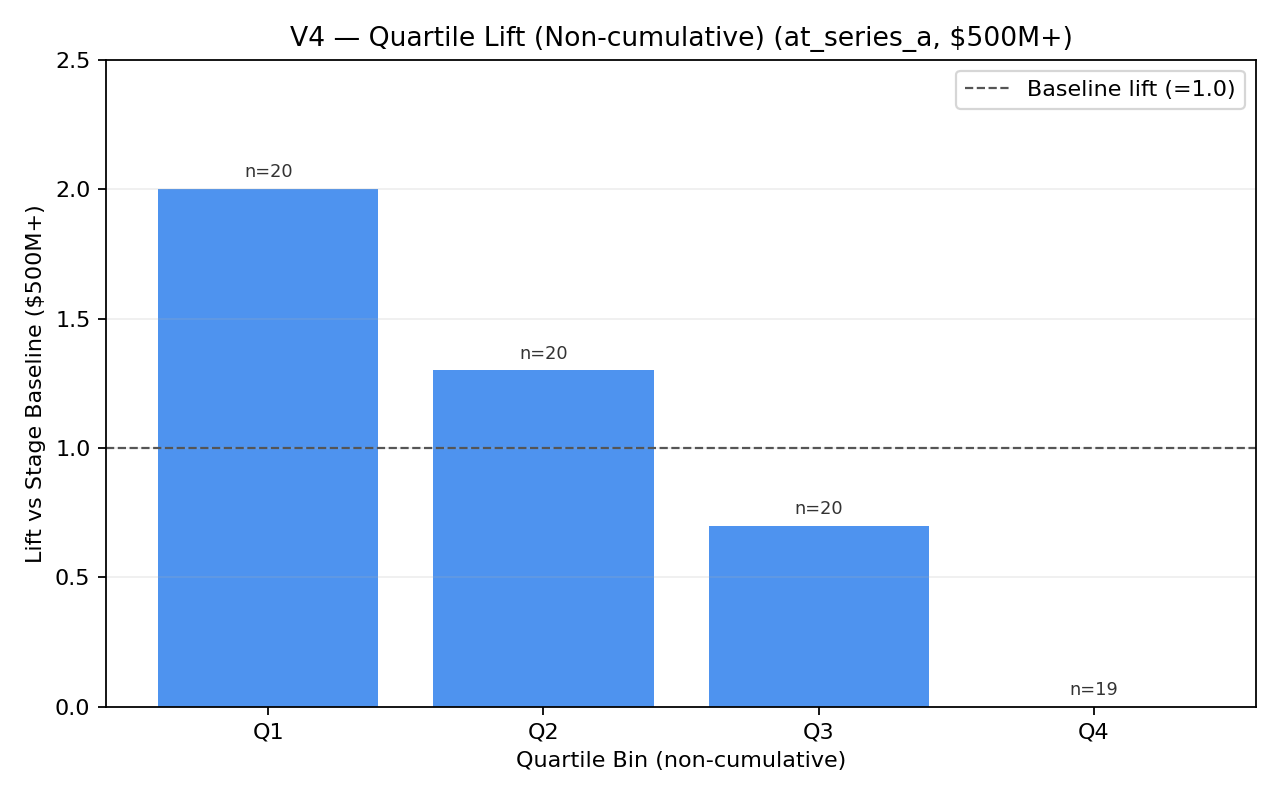
At Series A
n=79 • Baseline $500M+: 27.8% • Top quartile: 55.0% (2.0×)
| At Series A (n=79) | n | $100M+ | Lift | $500M+ | Lift | $1B+ | Lift |
|---|---|---|---|---|---|---|---|
| Top Quartile (Q1) | 20 | 90.0% | 2.2× | 55.0% | 2.0× | 50.0% | 2.2× |
| Upper-Mid Quartile (Q2) | 20 | 50.0% | 1.2× | 35.0% | 1.3× | 25.0% | 1.1× |
| Lower-Mid Quartile (Q3) | 20 | 25.0% | 0.6× | 20.0% | 0.7× | 15.0% | 0.7× |
| Bottom Quartile (Q4) | 19 | 0.0% | 0.0× | 0.0% | 0.0× | 0.0% | 0.0× |
| Baseline | 79 | 41.8% | 1.0× | 27.8% | 1.0× | 22.8% | 1.0× |
Quartile Lift by Stage
$500M+ outcome rate by score quartile at each decision point.
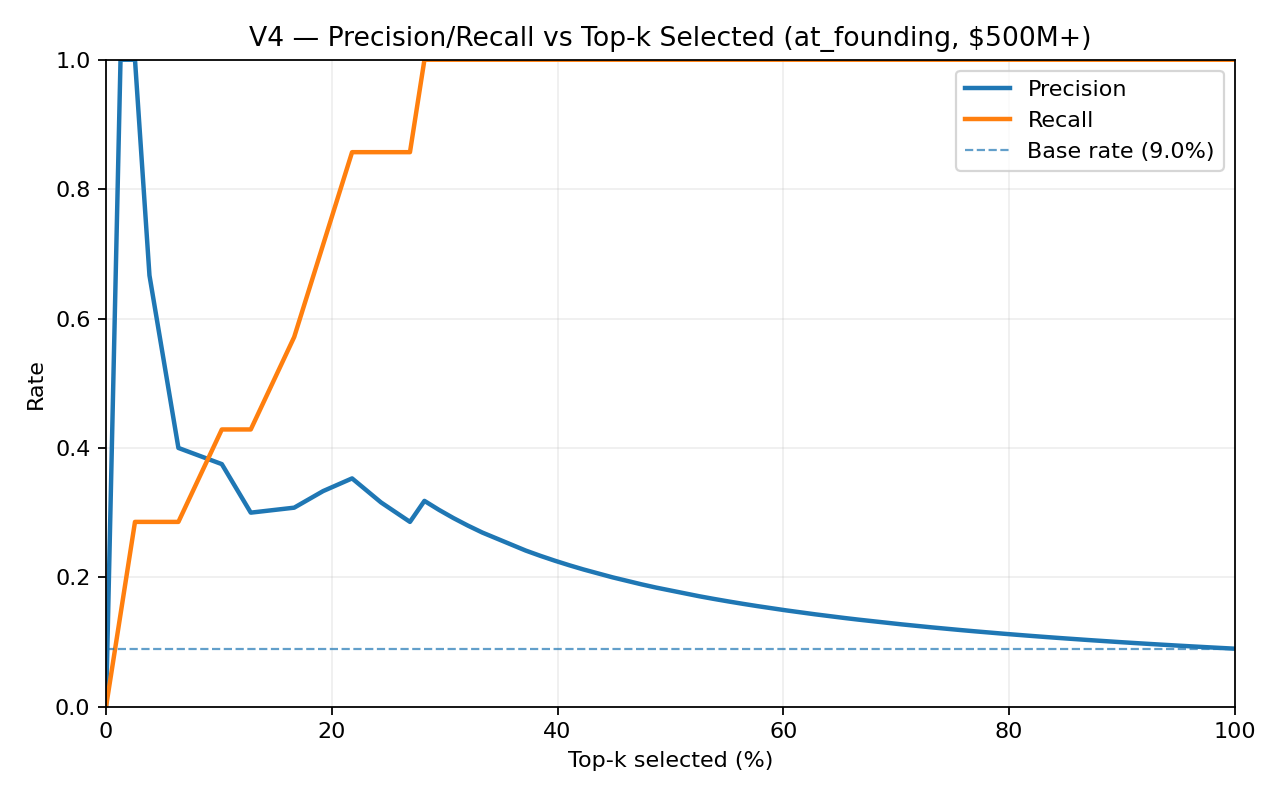
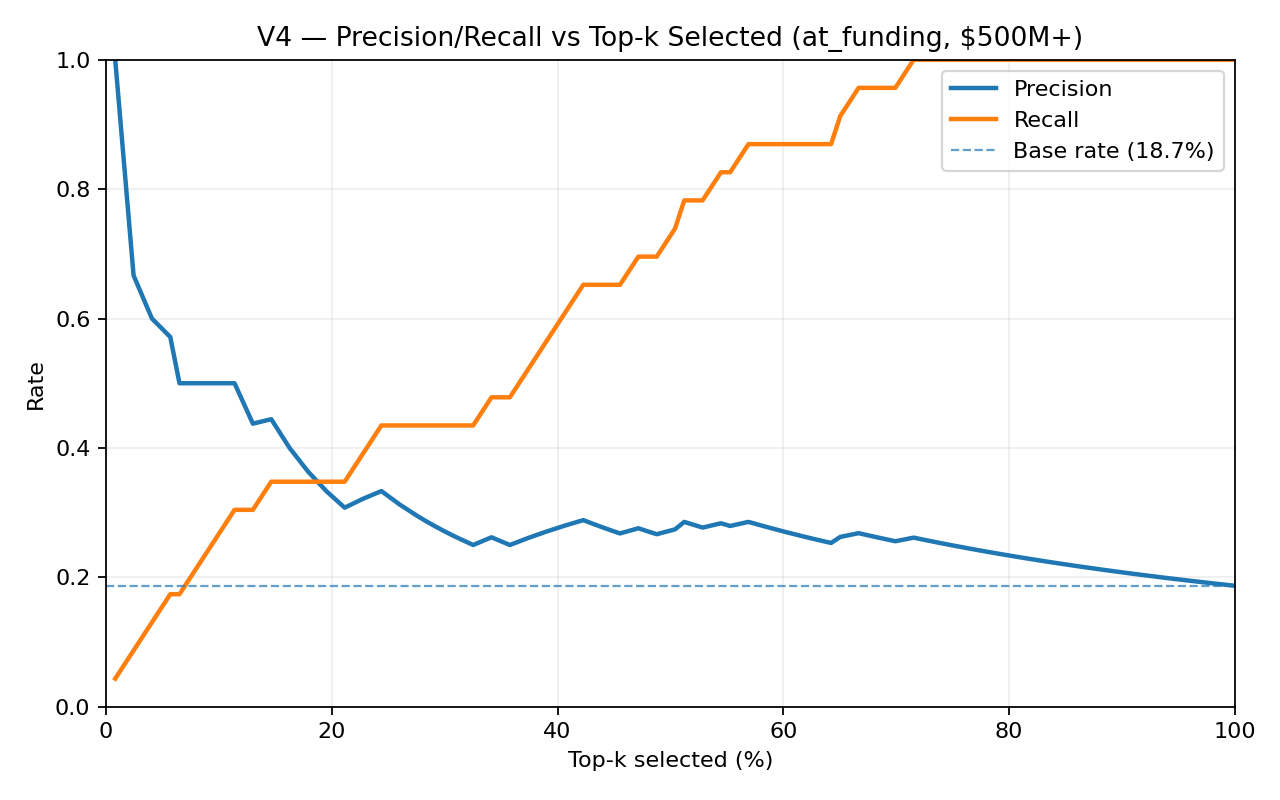
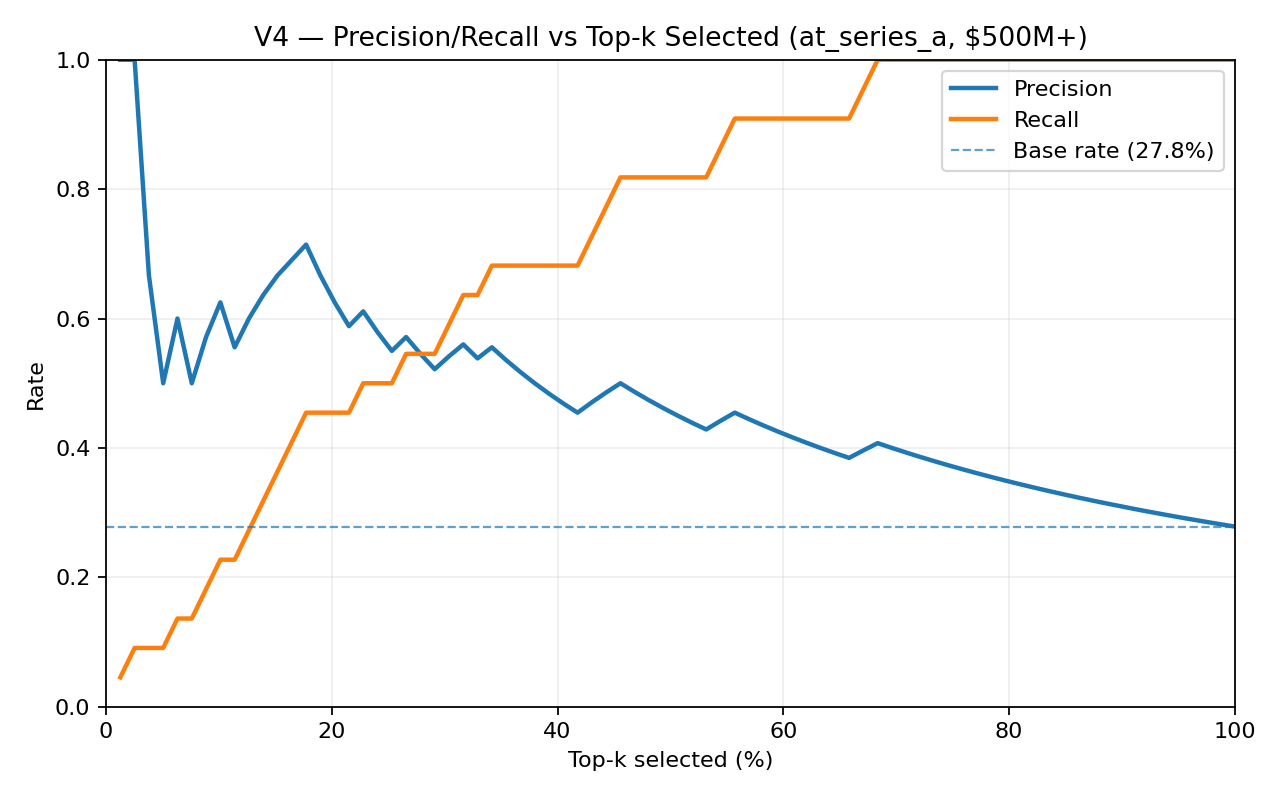
Precision/Recall Operating Curves by Stage
Cumulative top-k precision/recall curves for $500M+ outcomes.
Predictive Validation
The predictive test: does the model generalize forward in time? Walk-forward cross-validation trains on earlier founding-year cohorts, evaluates on later ones, and uses only information available at each stage — no future data leaks into training.
| Decision Point | Walk-Forward AUC | Signal Description |
|---|---|---|
| At Founding | 0.62 | Early signal from competition results and education trajectory |
| At First Funding | 0.57 | Founding signals augmented by round size and investor quality |
| At Series A | 0.84 | Strongest signal — adds milestone progression and traction markers |
An AUC of 0.84 at Series A means the model correctly ranks a random $100M+ outcome above a random non-outcome 84% of the time. The founding-stage AUC of 0.62 represents a modest early signal that strengthens as information accumulates through each subsequent stage.
Application to Fund I
The scoring system translates proprietary data on nearly 40,000 science fair alumni into stage-specific decision support. Each stage score provides a different lens on the ranked alumni pipeline.
Sourcing (Founding Score)
At founding — before any institutional capital — the ranked list shows $100M+ outcomes at 3.5× the baseline rate near the top. The founding score provides early signal across a pipeline of 50–100 active early-stage companies, helping prioritize outreach within a broad alumni universe.
Check Sizing (Funding Score)
At first funding, the model reaches a 0.57 walk-forward AUC, with top-quartile $500M+ rates of 32.3%. This is the fund's primary pre-commitment signal — the coverage tables above show how hit rate and recall trade off across different portfolio sizes at this stage.
Follow-On (Series A Score)
The strongest decision point: 0.84 AUC, with the coverage table showing hit rates from 55% in the top quartile down to 27.8% at baseline. Unicorn rates in the top quartile reach 50%. Signal is strongest here because the model incorporates milestone progression, round scaling, and traction markers alongside the founding and funding features.
The scoring system does not replace judgment. It translates proprietary data — competition results, career trajectories, funding patterns, milestone progression — into a ranked list at each decision point, providing the data foundation for capital allocation decisions.
Interpretation Notes
- Stage cohort sizes differ because each decision point uses its own eligible universe (78 at founding → 123 funded → 79 Series A+).
- Early signal is observable before institutional capital. The founding score shows top-quartile $100M+ rates at 3.5× the baseline rate, using only competition results, education trajectory, and sector signals.
- Signal strengthens with information. Top-quartile $100M+ lift ranges from 1.9–3.5× across stages, and CV AUC rises from 0.62 at founding to 0.84 at Series A. Each stage adds non-redundant predictive value.
- The score is a rank, not P($500M+). The V4 score is a percentile rank of stage-specific $100M+ output. $500M+ probabilities are separately calibrated and are not row-level monotonic with score.
Definitions
| $500M+ | Exit value or last known valuation ≥$500M. |
| $1B+ (Unicorn) | Exit value or last known valuation ≥$1B. |
| Funded | Institutional capital raised ≥$500K. |
| Series A+ | Venture stage at Series A or later, funded ≥$500K. |
| Walk-Forward CV | Trains on earlier cohorts, tests on later ones. No future data leaks into training. |
| AUC | Area Under ROC Curve. Probability a positive is ranked above a negative. 0.5 = random; 1.0 = perfect. |
| Lift | Outcome rate in a tier divided by the baseline rate for the full stage cohort. |